

Blue Owl Capital Inc. stocks have been trading up by 5.67 percent amid upbeat sentiment from strong fund-raising and AUM growth.
Key Takeaways
- Blue Owl Capital shares have fallen about 67% from their early‑2025 peak, pulling in bankers pitching a full or partial sale of the firm.
- A Wall Street Journal report says bankers are exploring an OWL sale, while TD Cowen points to deep value, industry scarcity, and possible buyers including T. Rowe Price and Carlyle.
- Despite weaker sector sentiment, Piper Sandler kept an Overweight stance on OWL before Q3 and trimmed its target from $13 to $12, citing solid fee economics.
- The company is pushing beyond private credit, adding products for pensions and insurers and planning a balance‑sheet‑light expansion of its insurance business to lock in long‑duration capital.
- Stack Infrastructure faces a roughly one‑year delay on its $3B Jupiter data center project in New Mexico, prompting a force majeure notice from Oracle even as both sides reaffirm project commitments.
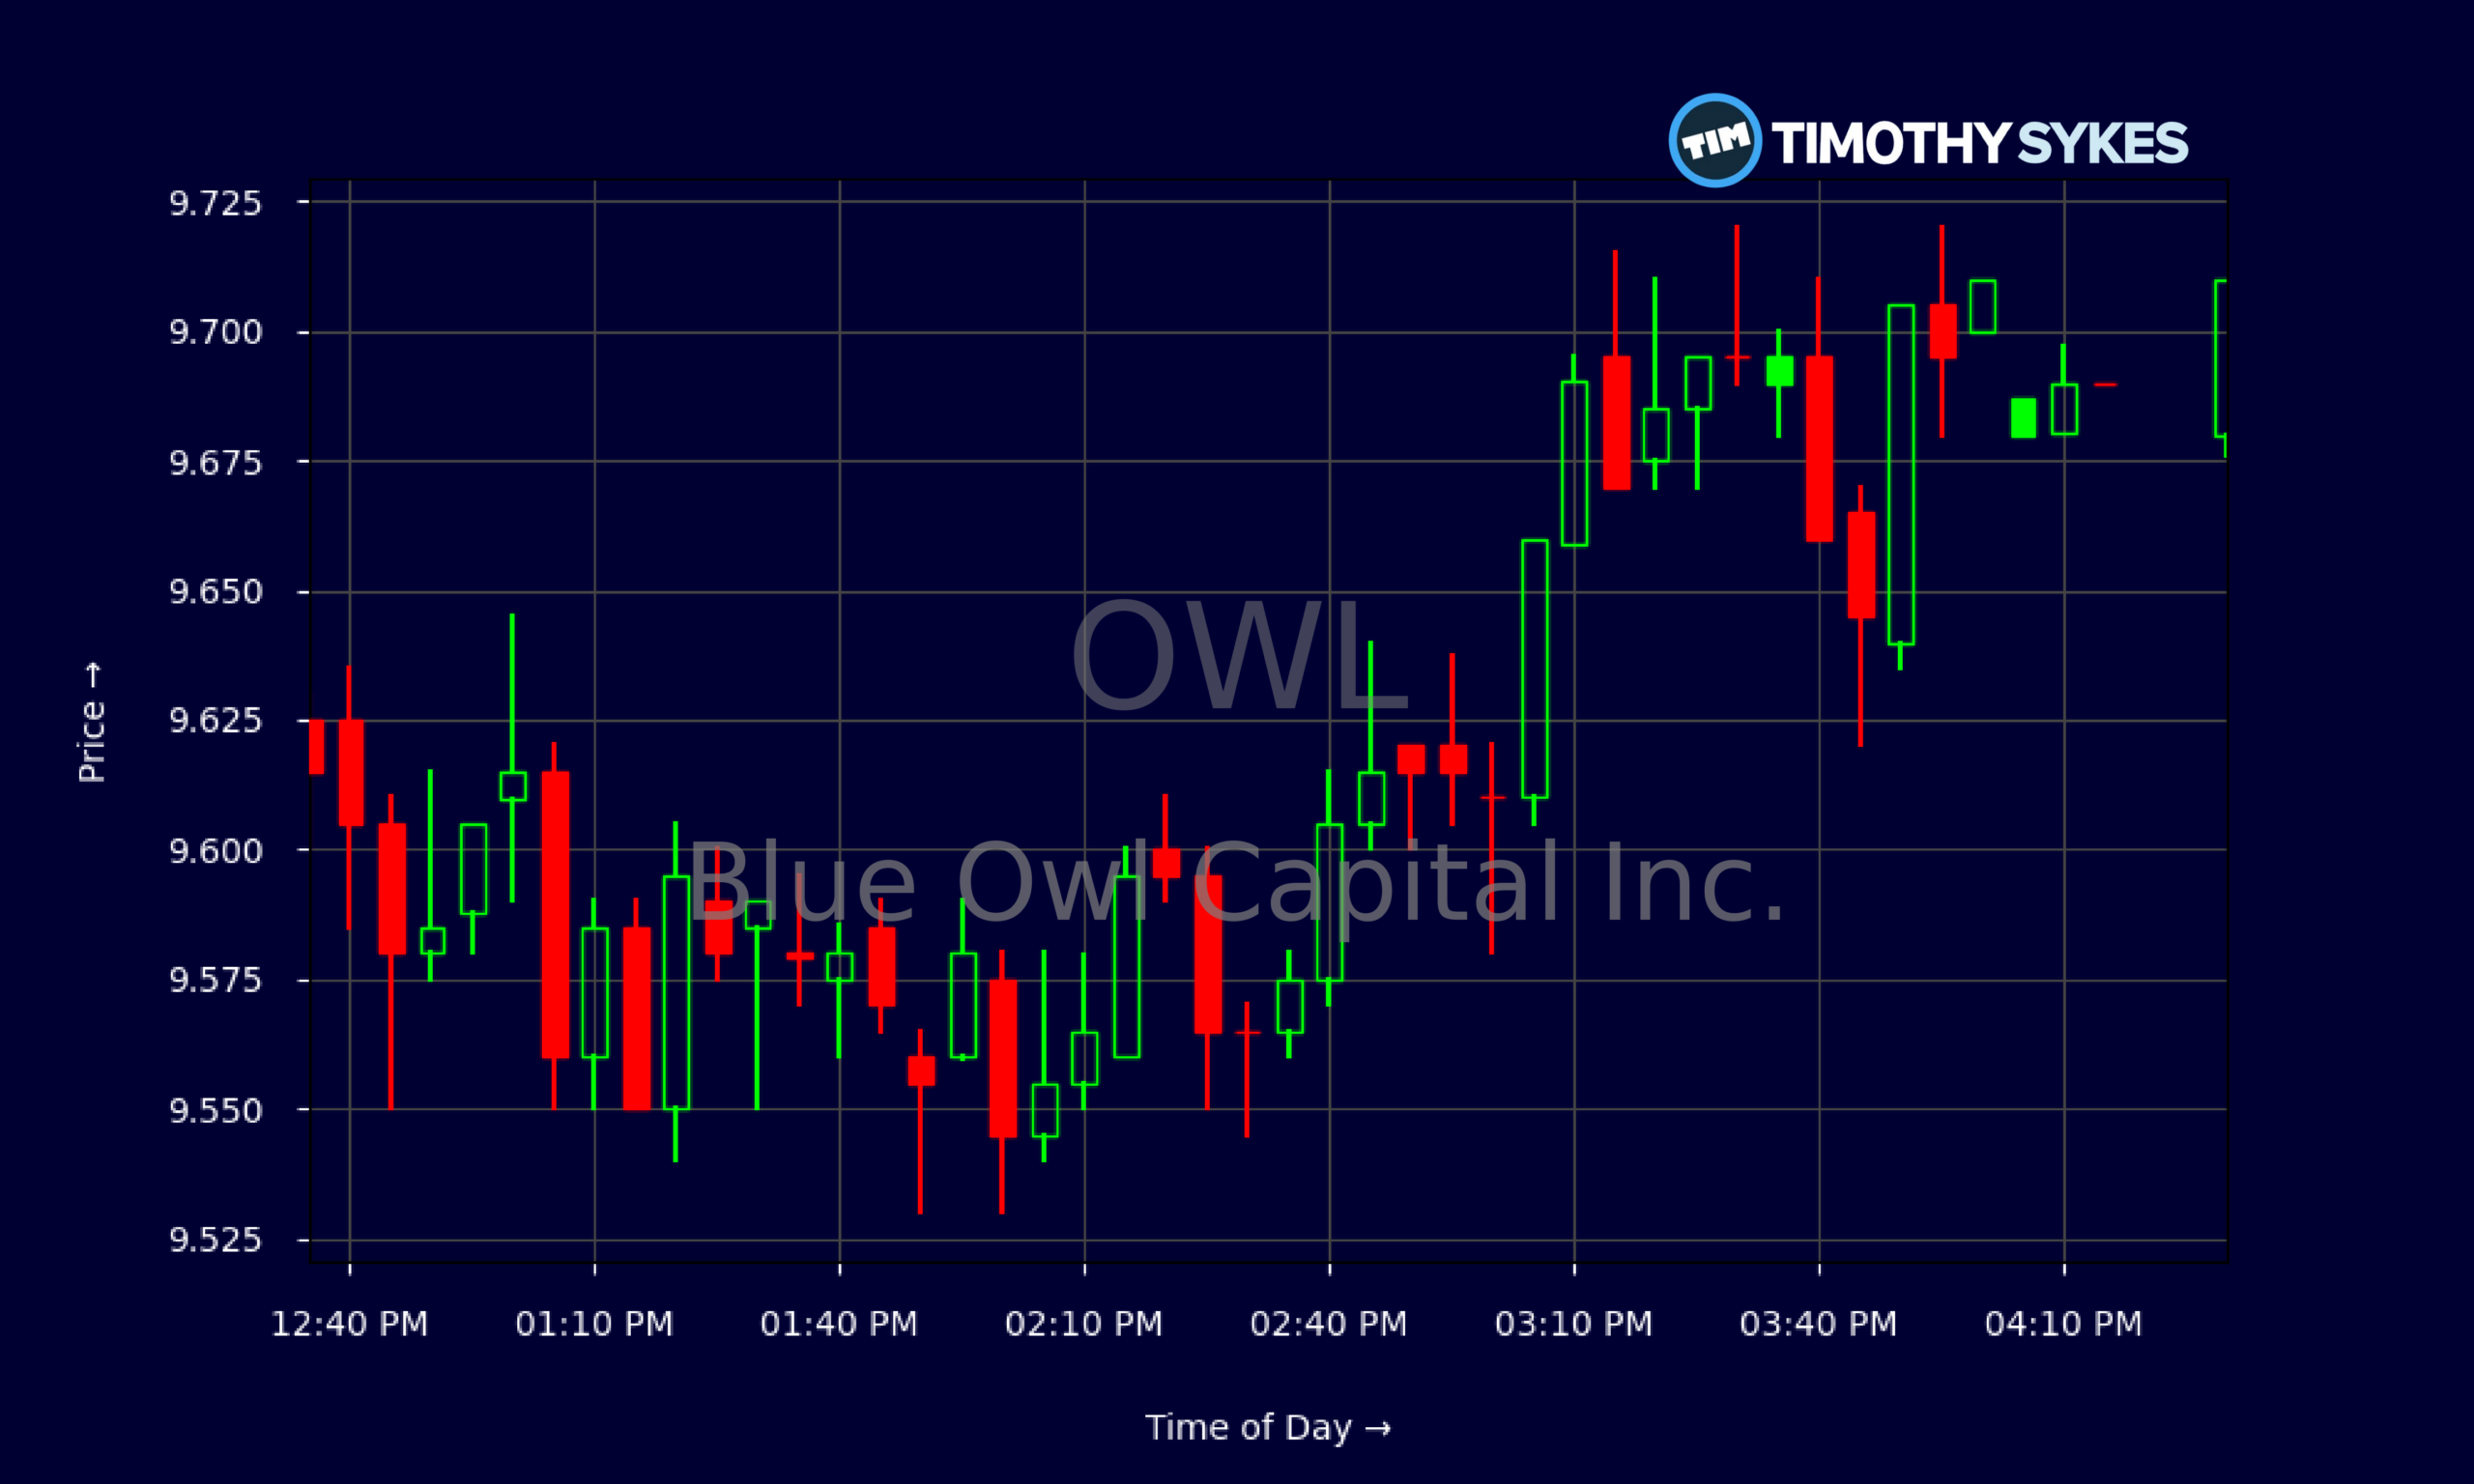
Live Update At 16:48:32 EDT: On Thursday, October 22, 2026 Blue Owl Capital Inc. stock [NYSE: OWL] is trending up by 5.67%! Discover the key drivers behind this movement as well as our expert analysis in the detailed breakdown below.
Quick Financial Overview
OWL is trading like a war‑torn chart, but the numbers underneath tell a more nuanced story. Over the last few weeks, Blue Owl Capital has mostly chopped between about $8.80 and $9.70, with the latest close near $9.71 after a steady intraday grind higher from a $8.96 open. That’s a controlled uptrend, not a wild short squeeze.
Zooming out, the daily chart from late September 2026 shows OWL repeatedly bouncing near the high‑$8s and failing around mid‑$9s. Traders are watching that $9.70–$9.80 zone as the next real breakout test; a clean move and hold above it would mark the strongest upside momentum this month.
More Breaking News
Fundamentally, Blue Owl Capital is a high‑multiple, fee‑driven machine. The firm reports about $2.87B in annual revenue and a profit margin from continuing operations around 11%, but the P/E ratio sits near 79. That tells traders the market still prices OWL as a growth platform, not a sleepy value name. Add a roughly 10% cash dividend yield on a $0.92 payout, and OWL becomes a classic yield‑plus‑growth puzzle: big income on paper, but with leverage (debt‑to‑equity above 2x) and sentiment risk attached. This blend sets the stage for sharp re‑ratings when news hits.
Why Traders Are Watching OWL Right Now
Blue Owl Capital is stuck in one of those classic broken‑chart, strong‑story setups that active traders love to debate. On one side, OWL is down roughly 67% from its January 2025 highs – that’s a brutal reset for a $319B‑AUM alternative manager that has pushed hard into private credit and digital infrastructure. On the other, that same collapse is what attracted Wall Street deal bankers.
According to a Wall Street Journal report, bankers are exploring a full or partial sale of Blue Owl Capital. TD Cowen leans into that angle, stressing OWL’s “deep fundamental value” and “scarcity value” as consolidation ripples through the asset‑management space, and even flagging strategic buyers like T. Rowe Price and Carlyle. For traders, that’s the key: credible sale chatter plus named potential acquirers often adds takeover premium and supports the bid on every pullback.
TD Cowen also raised its price target on OWL from $15 to $16 and kept a Buy rating, calling it one of its top picks among traditional asset managers heading into Q3 2026 earnings. Piper Sandler took a more cautious route, trimming its target from $13 to $12 but still labeling OWL Overweight. The message from both notes is similar: sentiment is damaged, but the fee engine – management fees, fee‑related earnings, and margins – still looks solid.
Wells Fargo sits in the middle with an Equal Weight rating and a $10 target, framing Blue Owl Capital as a name with visible vulnerabilities but durable strengths. Layer on OWL’s decision to cap redemptions from two private credit funds at 5%, plus a one‑year delay at the $3B Jupiter data center that triggered a force majeure notice from Oracle, and you get a stew of risk, opportunity, and headline‑driven trading.
At the same time, OWL is not standing still. Management is widening the lens beyond private credit, rolling out products aimed at pensions and insurers and preparing a major expansion of its insurance‑related business using a balance‑sheet‑light model. On top of that, the Stack Infrastructure arm is arranging an A$8.6B (about $6B), five‑year loan for a huge Melbourne data center, and Blue Owl Capital has already spent $1B on IPI Partners while launching Kirkwood Infrastructure Group to ride AI infrastructure demand. That growth push explains why strategic buyers and Wall Street desks are still paying close attention, even with the stock crushed.
Conclusion
For active traders, OWL is a lesson in how ugly charts and powerful narratives can collide. Blue Owl Capital sits at the crossroads of several major themes: private credit, insurance capital, and AI‑driven digital infrastructure, all wrapped in a high‑yield, high‑multiple stock that has lost roughly two‑thirds of its value from the peak. The banker‑driven sale chatter and repeated references to scarcity value show why the name refuses to die, despite fund redemption caps and project delays at Stack Infrastructure’s Jupiter site.
Q3 2026 earnings on 2026/10/29 will be the next big catalyst. Street views are split but constructive – TD Cowen lifting its OWL target to $16 and calling it a top pick, Piper Sandler still overweight even after a target cut, and Wells Fargo planting a neutral flag at $10. All of this plays out against hard numbers: $319B of AUM, strong fee margins, heavy leverage, and a dividend yield near 10% that traders will only trust if the cash flows keep coming.
In setups like this, discipline matters more than opinions. As Tim Sykes likes to say, “Patterns repeat, but only disciplined traders get paid to recognize them.” As millionaire penny stock trader and teacher Tim Sykes says, “There is always another play around the corner; don’t chase just because you feel FOMO.”. OWL’s pattern is clear: deep drawdown, real strategic value, and a tape that moves fast on every new headline. For educational and research purposes, traders who study that pattern, map their risk, and cut losses fast are the ones most likely to stay in the game when Blue Owl Capital’s next big move hits the tape.
This is stock news, not investment advice. Timothy Sykes News delivers real-time stock market news focused on key catalysts driving short-term price movements. Our content is tailored for active traders and investors seeking to capitalize on rapid price fluctuations, particularly in volatile sectors like penny stocks. Readers come to us for detailed coverage on earnings reports, mergers, FDA approvals, new contracts, and unusual trading volumes that can trigger significant short-term price action. Some users utilize our news to explain sudden stock movements, while others rely on it for diligent research into potential investment opportunities.
Dive deeper into the world of trading with Timothy Sykes, renowned for his expertise in penny stocks. Explore his top picks and discover the strategies that have propelled him to success with these articles:
- Penny Stocks Trading Guide
- Best Penny Stocks Under $1 to Buy Today
- Top 8 Penny Stocks to Watch on Robinhood
Once you’ve got some stocks on watch, elevate your trading game with StocksToTrade the ultimate platform for traders. With specialized tools for swing and day trading, StocksToTrade will guide you through the market’s twists and turns.
Dig into StocksToTrade’s watchlists here:




Leave a reply