

Suncor Energy Inc. stocks have been trading up by 4.46 percent after bullish headlines on oil prices and production outlook.
What Traders Need To Know
- Suncor Energy Inc. is selling offshore stakes in Terra Nova, White Rose, and West White Rose to Ithaca Energy for up to about CA$1.55B, while Ithaca takes on roughly CA$1.9B in future liabilities.
- Management is lifting monthly share repurchases from CA$500M to CA$750M, pointing to stronger capital returns and confidence in future cash flows.
- Major banks including CIBC, RBC, Raymond James, UBS, and Jefferies have all raised Suncor Energy Inc. price targets into the CA$110–CA$120 band while keeping constructive ratings.
- UBS highlights an overweight analyst consensus with a mean target near CA$110.13 versus a current share price around CA$76.27, implying notable upside potential.
- A climate‑damages case involving Suncor Energy Inc. is now before the U.S. Supreme Court, underscoring headline risk even as the core equity story trends bullish.
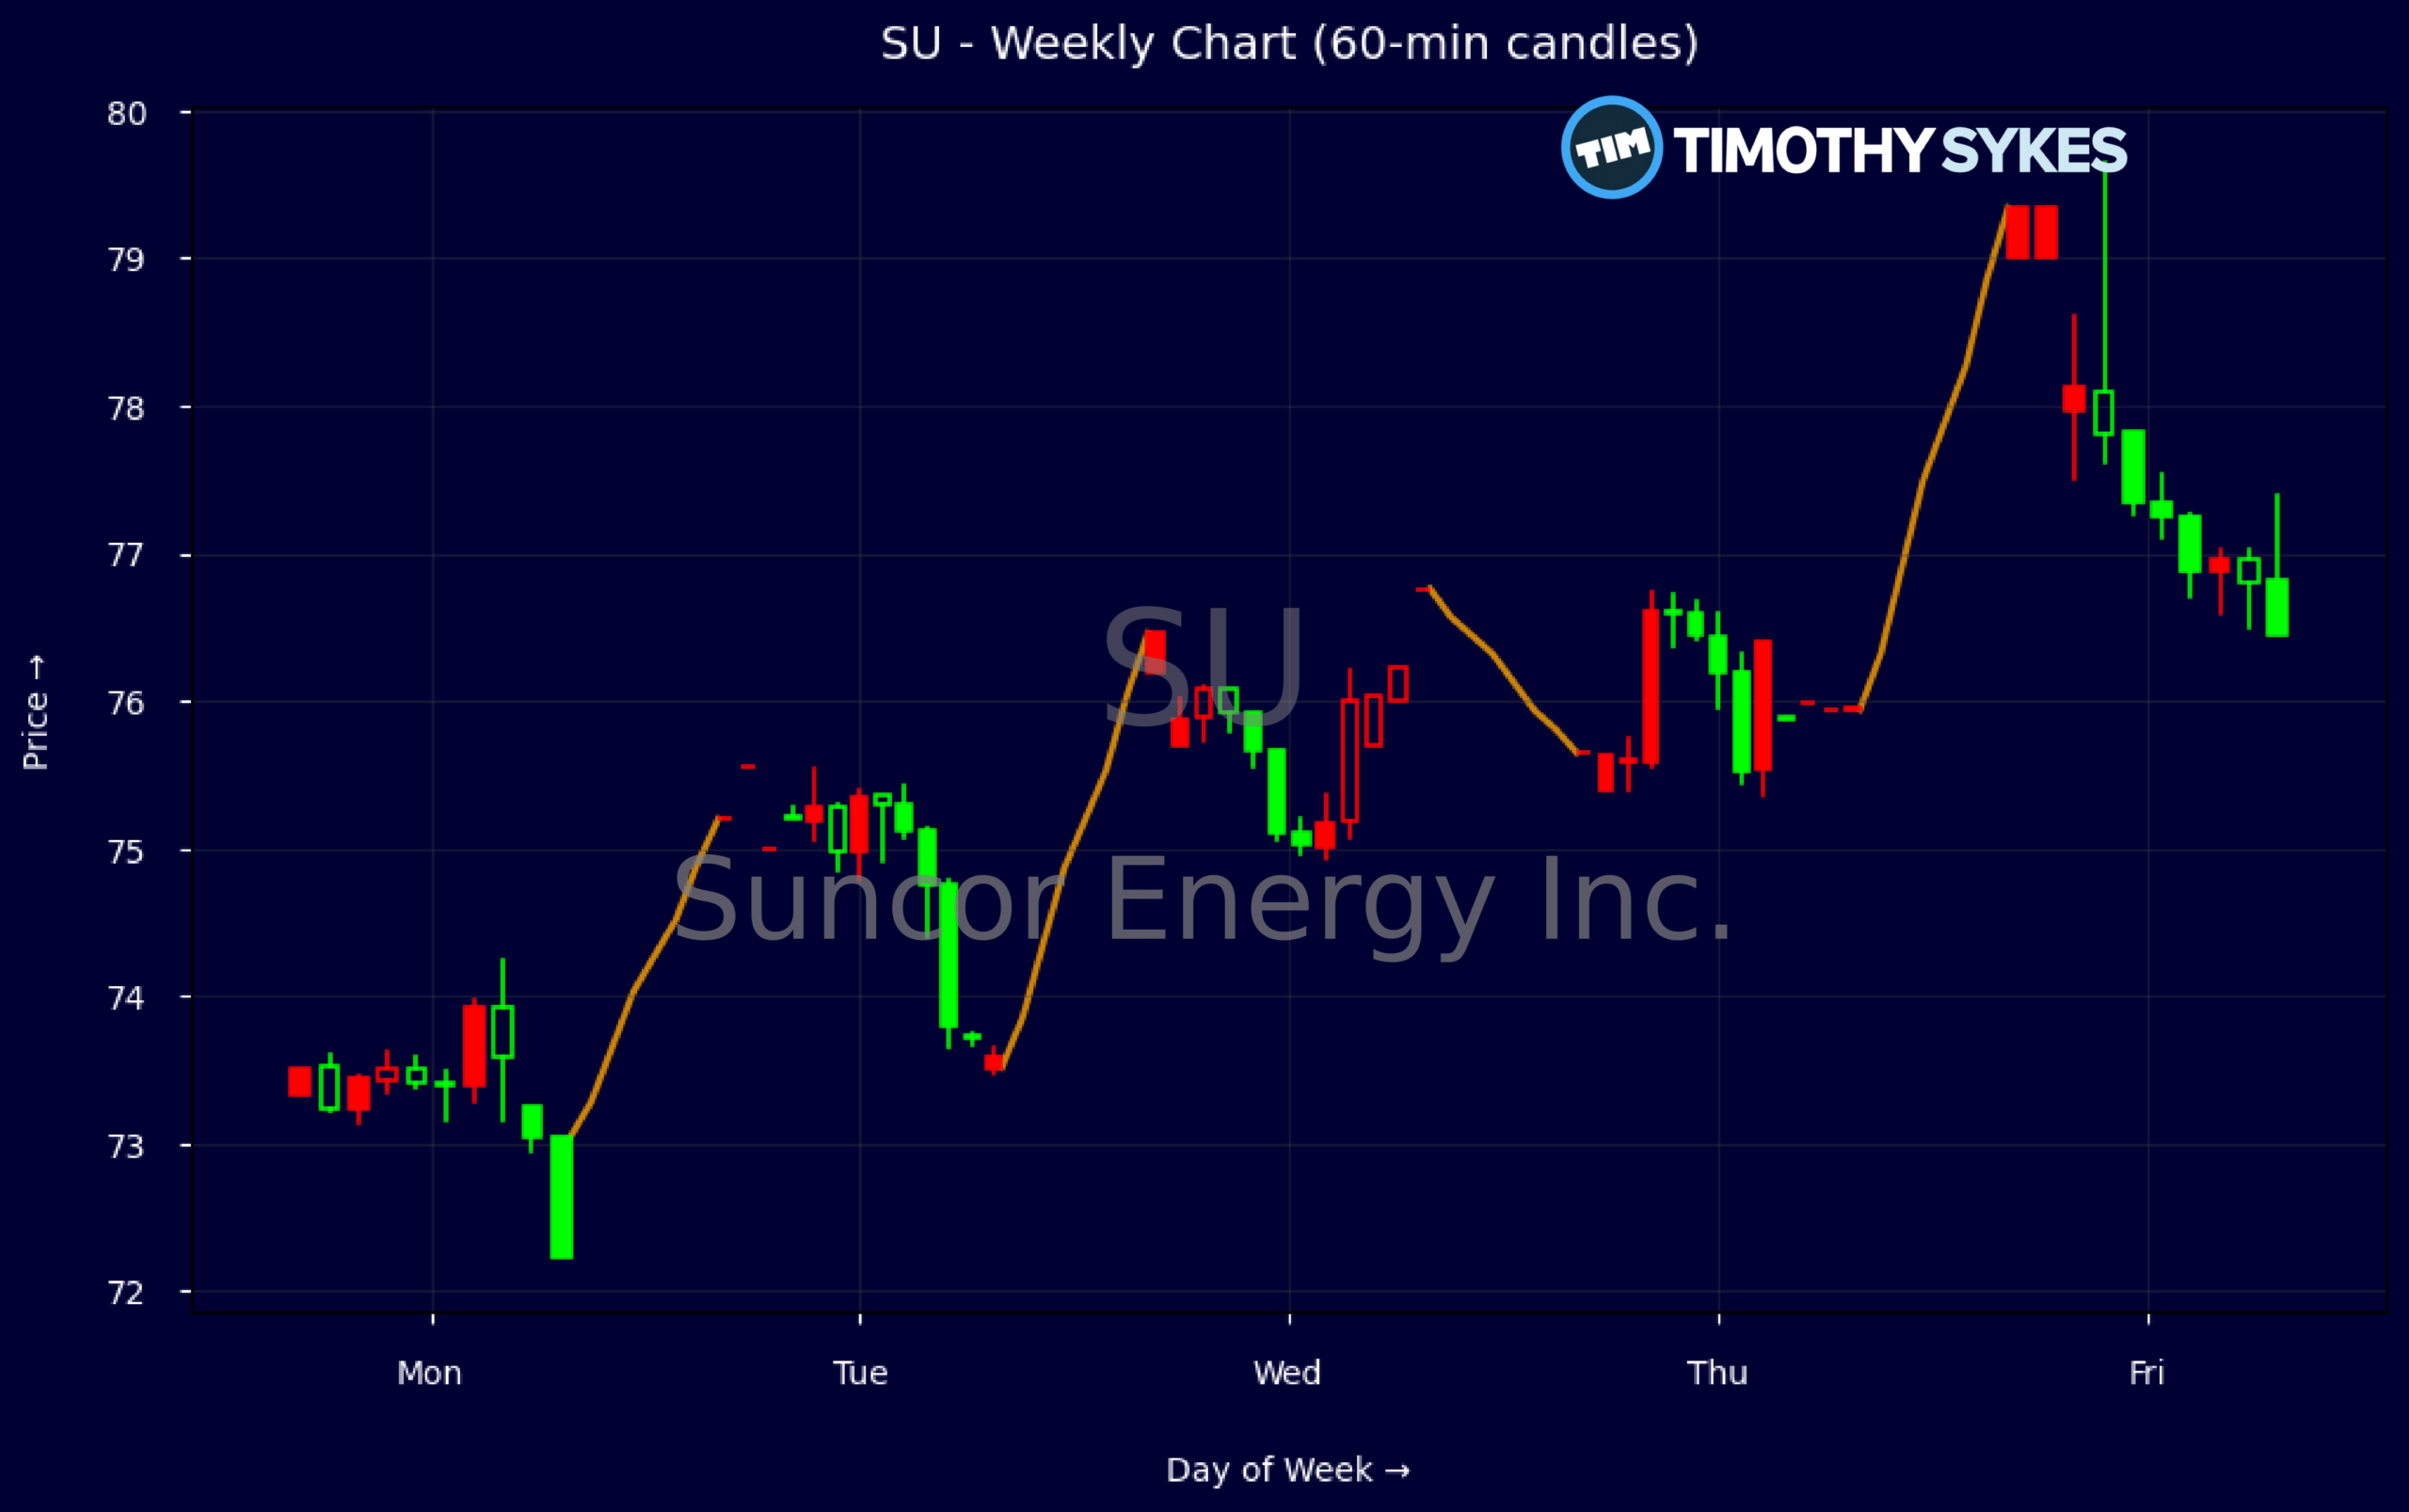
Weekly Update Oct 12 – Oct 16, 2026: On Saturday, October 17, 2026 Suncor Energy Inc. stock [NYSE: SU] is trending up by 4.46%! Discover the key drivers behind this movement as well as our expert analysis in the detailed breakdown below.
Energy industry expert:
Analyst sentiment – positive
Suncor’s current fundamentals position it as a top‑tier integrated oil sands levered CF machine within the North American energy complex. EBIT margin around 21% and EBITDA margin above 32% on C$52B revenue show strong upstream and downstream integration. ROE near 19–31% and ROA around 10–15% significantly exceed most large‑cap oil peers, supported by low leverage (D/E ~0.3, interest coverage ~25x, current ratio 1.7). Trading at ~13.7x earnings and ~9.4x cash flow, valuation remains undemanding relative to quality and FCF durability.
Technically, the weekly tape shows a clear short‑term uptrend: successive higher closes from C$73.34 to C$79.01 with expanding ranges, indicating increasing buying conviction. Intraday 5‑minute action confirms steady bid absorption on dips, with volume building on pushes above C$76–77 and no meaningful supply until just below C$80. Dominant trend is bullish. A specific actionable level: C$75.50–76.00 is now key support; above it, long entries targeting C$82 with tight stops below C$74.80 are favored.
Near‑term catalysts are strongly constructive. Suncor is monetizing non‑core offshore assets for up to C$1.55B while offloading roughly C$1.4–1.9B of abandonment liabilities, improving portfolio quality and balance‑sheet resilience versus global fossil‑fuel benchmarks. Increasing NCIB buybacks to C$750M/month materially tightens free float and amplifies per‑share FCF growth. With multiple Buys/Outperforms and average targets above C$110, I view risk‑reward as attractive; my 12‑month base case is C$105–115, with support at C$72 and resistance near C$90.
More Breaking News
Quick Financial Overview
Suncor Energy Inc. is combining solid operating performance with a cleaner portfolio. Recent weekly trading shows SU moving from roughly CA$73 to just above CA$79, a firm upward trend that tells you buyers are in control. Intraday, a wide 5‑minute range from about CA$76.70 to CA$79.65 and a close near CA$78.05 signals active two‑way flow but with dips being bought. For short‑term traders, that CA$76–CA$77 zone now acts as a key near‑term support band.
On the fundamentals side, Suncor Energy Inc. is printing strong profitability, with EBIT margin above 20% and EBITDA margin in the low 30s. Revenue is about $52.38B with steady mid‑single‑digit growth over three years and double‑digit growth over five, backing the story of a scaled operator. Returns on equity near 20% and returns on assets in the high single digits show management is pulling solid performance from its asset base. A price‑to‑earnings ratio around 13.7 and price‑to‑cash‑flow near 9.4 leave room for re‑rating if cash returns keep ramping.
Balance sheet strength supports the aggressive capital plan. Total debt‑to‑equity at 0.3, interest coverage near 25, and a current ratio of 1.7 all suggest Suncor Energy Inc. has no immediate stress. Quarterly operating cash flow of about $5.66B and free cash flow around $4.31B comfortably cover recent dividends and buybacks. The announced sale of non‑core offshore assets, worth up to CA$1.55B while shedding about CA$1.4B of long‑tail liabilities, tightens the focus on oil sands. At the same time, boosting buybacks to CA$750M per month should provide a demand backstop on weakness.
Conclusion
Suncor Energy Inc. is lining up several bullish factors at once: a strong tape, robust cash generation, and a clear shift toward higher capital returns. SU has pushed from the low CA$70s toward CA$79 on the weekly chart, while intraday volatility shows active participation rather than exhausted momentum. With analysts clustering targets in the CA$110–CA$120 area against a current price in the mid‑CA$70s, the risk/reward skew still leans to the upside for now.
Strategically, the Ithaca Energy deal cleans up the portfolio and removes heavy abandonment and compliance liabilities, which matters when the cycle eventually turns. Suncor Energy Inc. is choosing to recycle non‑core offshore stakes into oil sands focus and stepped‑up buybacks, supported by wide margins and healthy leverage metrics. The climate lawsuit in the U.S. Supreme Court is a real overhang, but it is more of a slow‑burn risk than a day‑to‑day trading driver at this stage.
For traders, that means respecting both the upside path and the headline risk. Key levels sit in the CA$76–CA$77 support band and the psychological CA$80 area above. As I tell my students, “When a stock shows rising targets, rising buybacks, and rising price all at once, you trade the strength—but you still define your risk as if the story could change tomorrow.” In that same spirit of disciplined trading, I remind them that outsized moves in names like SU are built one session at a time; as millionaire penny stock trader and teacher Tim Sykes says, “Small gains add up over time; focus on building wealth gradually, not chasing jackpots.”. This is educational analysis only, not a recommendation to buy or sell SU.
“,”scores”:{“risk-level”:”medium”},”trade”:”true
This is stock news, not investment advice. Timothy Sykes News delivers real-time stock market news focused on key catalysts driving short-term price movements. Our content is tailored for active traders and investors seeking to capitalize on rapid price fluctuations, particularly in volatile sectors like penny stocks. Readers come to us for detailed coverage on earnings reports, mergers, FDA approvals, new contracts, and unusual trading volumes that can trigger significant short-term price action. Some users utilize our news to explain sudden stock movements, while others rely on it for diligent research into potential investment opportunities.
Dive deeper into the world of trading with Timothy Sykes, renowned for his expertise in penny stocks. Explore his top picks and discover the strategies that have propelled him to success with these articles:
- Penny Stocks Trading Guide
- Best Penny Stocks Under $1 to Buy Today
- Top 8 Penny Stocks to Watch on Robinhood
Once you’ve got some stocks on watch, elevate your trading game with StocksToTrade the ultimate platform for traders. With specialized tools for swing and day trading, StocksToTrade will guide you through the market’s twists and turns.
Dig into StocksToTrade’s watchlists here:





Leave a reply