

Ondas Inc stocks have been trading down by -5.34 percent amid investor concerns over its latest operational and financing developments.
Key Takeaways
- Shares of ONDS have slid from around $7.40 to under $6.00 over recent sessions, showing a steady downside trend.
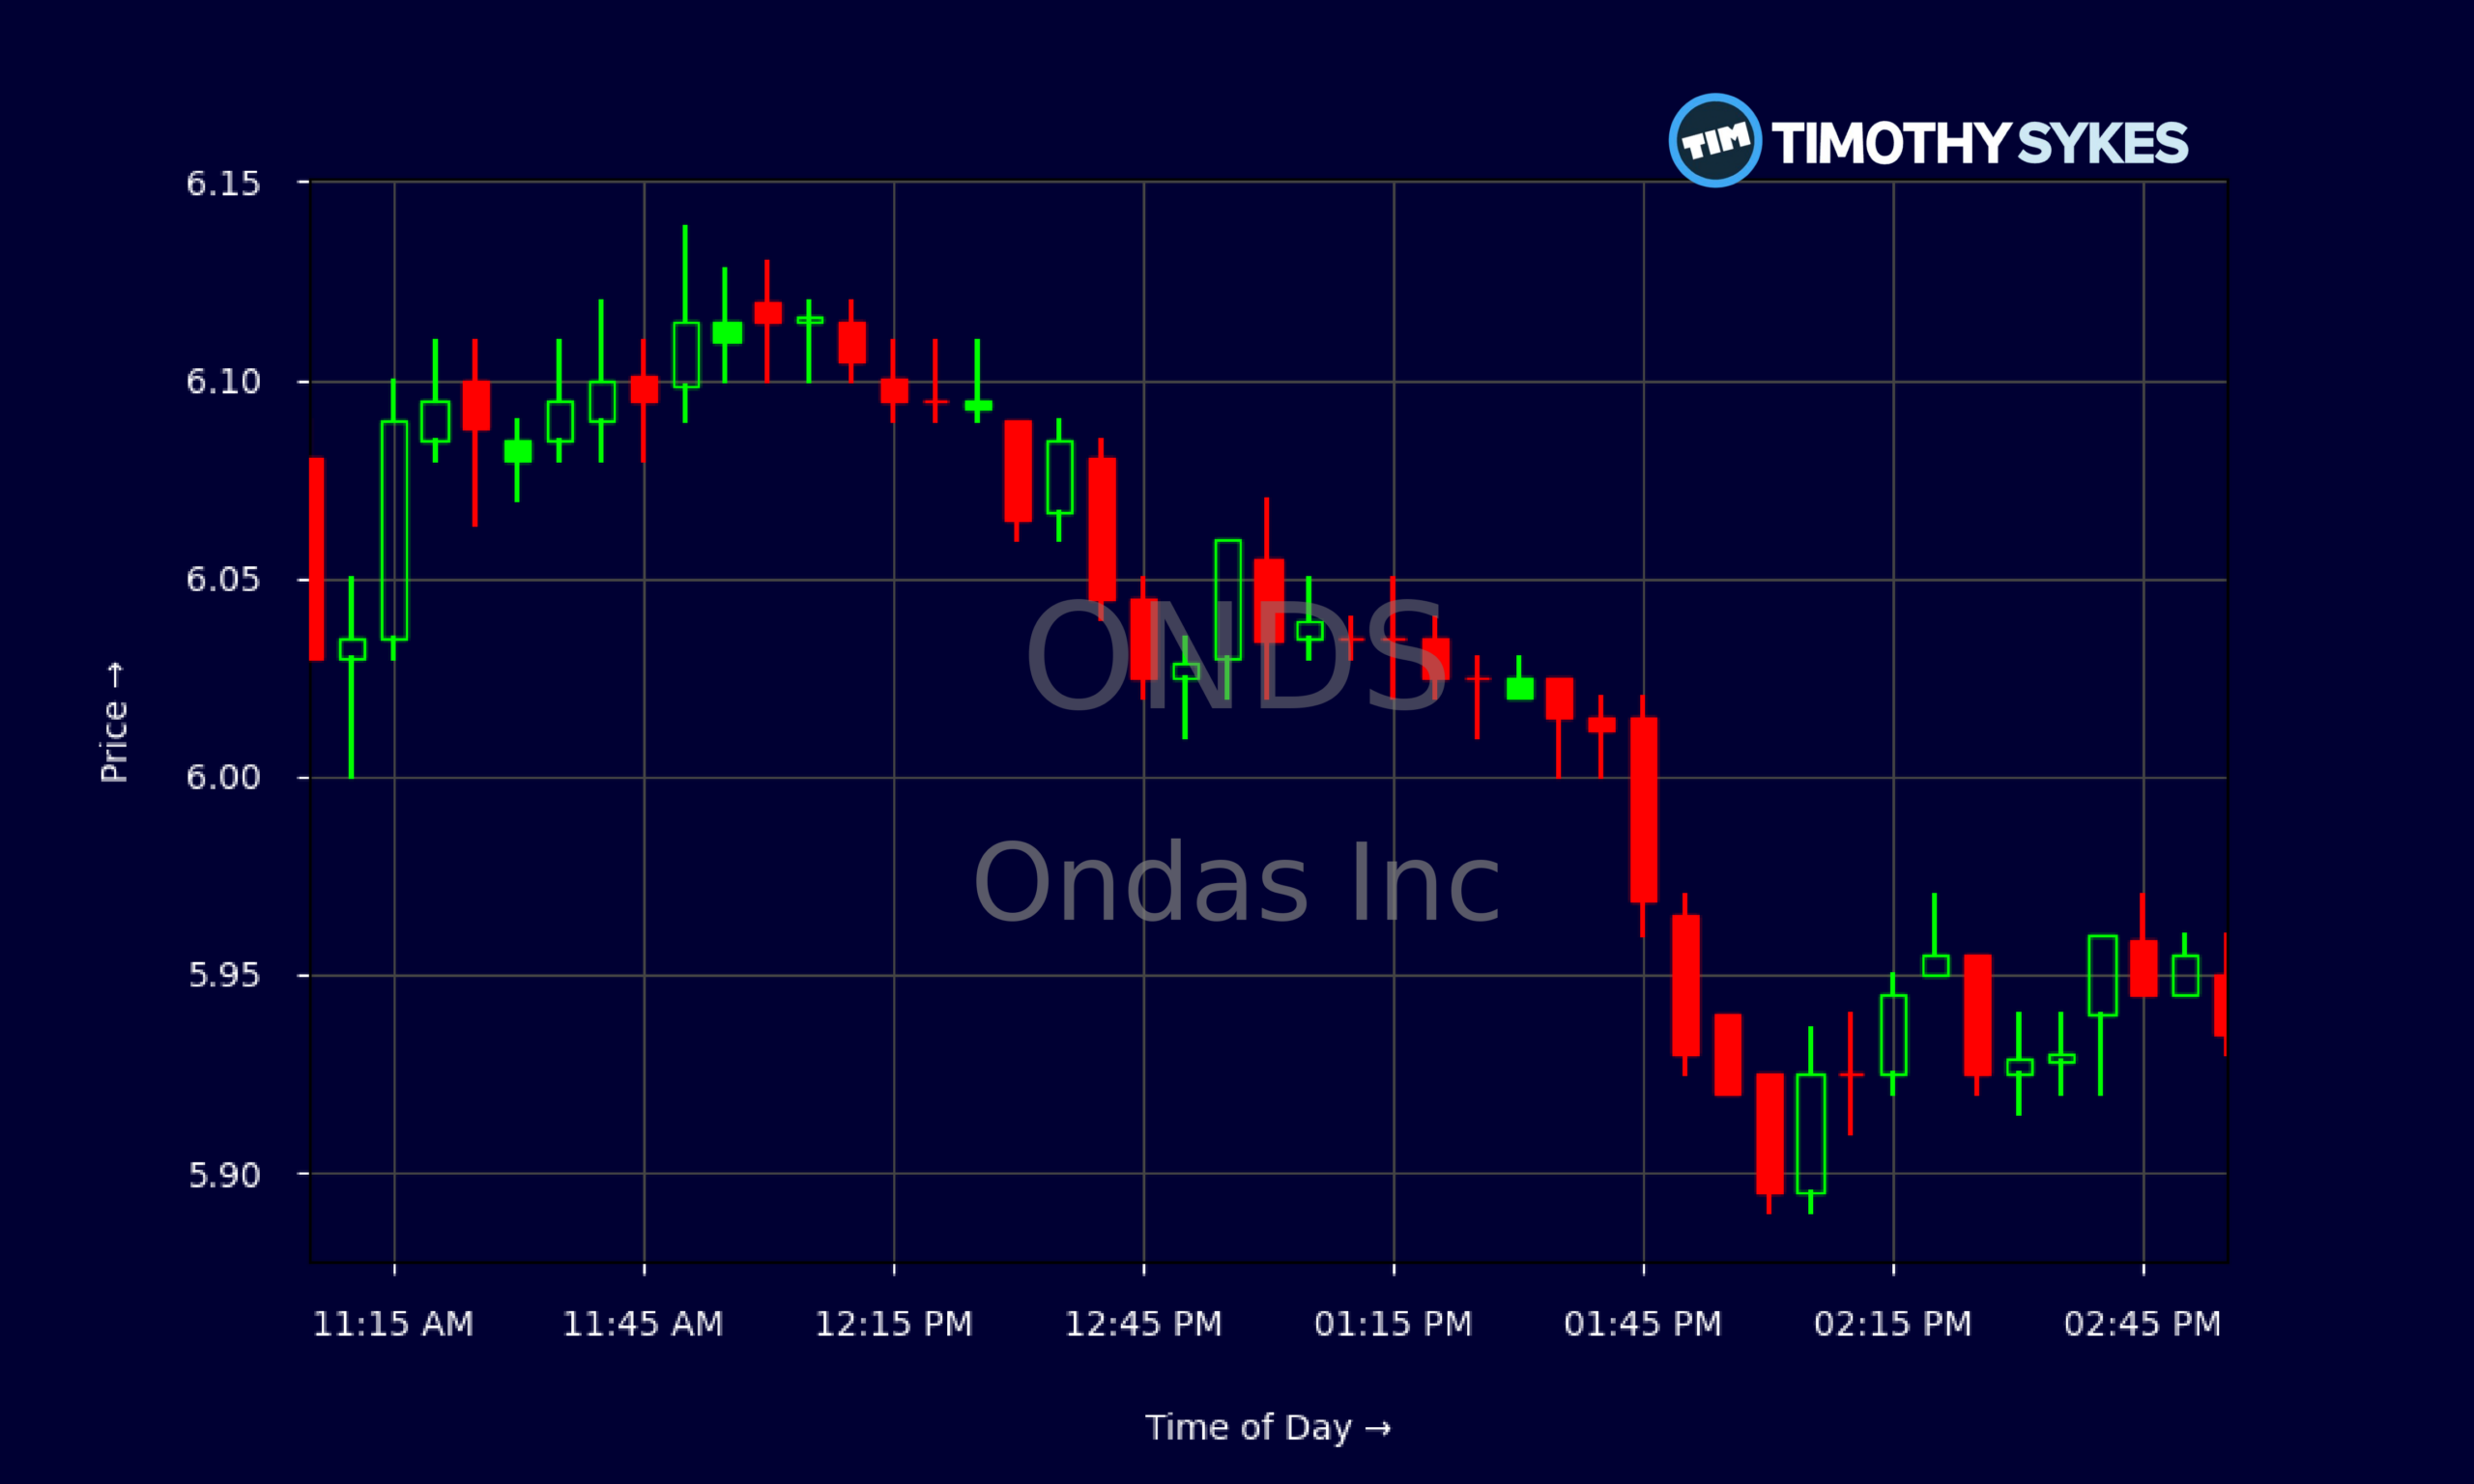
- Intraday trading in ONDS is tight, with most action between $5.90 and $6.10, signaling short-term consolidation after the selloff.
- The latest report shows Ondas Inc posting about $83.8M in quarterly revenue but also a sizeable net loss, highlighting a high-growth, high-burn profile.
- ONDS carries over $1.38B in cash and short-term investments with minimal debt, giving the company a substantial liquidity cushion.
- Traders are focusing on whether ONDS can hold the $5.90–$6.00 area or if another leg lower opens more downside.
Live Update At 15:03:23 EDT: On Thursday, October 22, 2026 Ondas Inc stock [NASDAQ: ONDS] is trending down by -5.34%! Discover the key drivers behind this movement as well as our expert analysis in the detailed breakdown below.
Quick Financial Overview
ONDS is trading like a classic high-growth, high-burn story. The daily chart shows Ondas Inc fading from the $7.60–$7.70 area in late September 2026 down toward $5.94 on the most recent close. That is a controlled, step-by-step drift lower, not a panic flush, which matters for short-term trading plans.
On the fundamentals side, ONDS reported roughly $83.8M in quarterly revenue, backed by a solid 43.7% gross margin. The problem is costs. Operating expenses near $179.8M drove an operating loss of about $143.7M and a net loss around $88.3M. For traders, that screams “story stock” — strong top-line growth, heavy spending, and no clear path to near-term profitability yet.
More Breaking News
At the same time, the balance sheet of Ondas Inc is loaded with liquidity. Cash and short-term investments sit around $1.38B, while total debt is tiny in comparison. Current and quick ratios above 8 show ONDS has plenty of runway to keep funding operations. That cash cushion is why traders still give ONDS room, even with negative free cash flow around -$93.8M this quarter.
Why Traders Are Watching ONDS Price Action Now
The chart is doing the talking right now. ONDS topped out near $7.70 in late September and has been grinding lower almost every session, closing recently at $5.94. Each bounce has been weaker, with lower highs from $7.68 to $7.42, then into the low $6s. That stair-step pattern shows persistent supply — traders are using every pop in Ondas Inc to lock in gains or exit.
Zoom into the intraday 5-minute chart and you see ONDS stuck mostly between $5.90 and $6.10 for hours. Early in the day, ONDS pushed over $6.30, topping around $6.34, then faded steadily. By the afternoon, the tape turned sleepy, with tiny candles and tight spreads. That shift from range expansion to compression often signals a bigger move is coming — the only question is direction.
Fundamentals add fuel to the debate. ONDS sports quick revenue growth (three-year growth above 160%) but burns cash aggressively, with operating cash flow around -$86.1M in the latest quarter. Yet Ondas Inc holds about $657.9M in cash and over $1.38B including short-term investments, with nearly no long-term debt. This mix — strong balance sheet, weak earnings — attracts momentum traders, not traditional value screens.
For active trading, that means ONDS is a pure price-action vehicle. The $6.30–$6.40 zone now acts as short-term resistance from today’s failed morning push. The $5.90 area marks support from multiple intraday lows. A clean break on volume from either level is where many short-biased and long-biased traders will look for their next setup in ONDS.
Conclusion
Right now ONDS sits at an interesting crossroads. The trend on the daily chart is down, but not broken in panic. The intraday action in Ondas Inc shows tight consolidation, suggesting traders are reloading for the next move. Under the hood, the company delivers meaningful revenue and high gross margins but continues to post heavy operating and net losses, along with sharply negative free cash flow.
What keeps ONDS on many watchlists is that balance sheet. With a current ratio near 10, very low debt, and over $1.38B in liquid assets, Ondas Inc has the financial runway to keep chasing its growth plans. That runway does not guarantee success, but it gives management time — and time is a valuable asset for speculative names.
For short-term traders, the plan usually starts with levels, not hopes. The $5.90–$6.00 support band is the key line in the sand for ONDS. Hold that, and you may see a squeeze toward $6.40 and above. Lose it with volume, and the next wave of selling often accelerates.
As Tim Sykes loves to remind traders, “Patterns repeat, but you have to be prepared — study the chart, respect the risks, and always, ALWAYS cut losses quickly.” That message aligns with his broader trading mantra. As millionaire penny stock trader and teacher Tim Sykes, says, “Cut losses quickly, let profits ride, and don’t overtrade.”. ONDS is a live example of that mindset right now. This analysis is for educational and research purposes only, and every trader must make their own decisions and manage their own risk.
This is stock news, not investment advice. Timothy Sykes News delivers real-time stock market news focused on key catalysts driving short-term price movements. Our content is tailored for active traders and investors seeking to capitalize on rapid price fluctuations, particularly in volatile sectors like penny stocks. Readers come to us for detailed coverage on earnings reports, mergers, FDA approvals, new contracts, and unusual trading volumes that can trigger significant short-term price action. Some users utilize our news to explain sudden stock movements, while others rely on it for diligent research into potential investment opportunities.
Dive deeper into the world of trading with Timothy Sykes, renowned for his expertise in penny stocks. Explore his top picks and discover the strategies that have propelled him to success with these articles:
- Penny Stocks Trading Guide
- Best Penny Stocks Under $1 to Buy Today
- Top 8 Penny Stocks to Watch on Robinhood
Once you’ve got some stocks on watch, elevate your trading game with StocksToTrade the ultimate platform for traders. With specialized tools for swing and day trading, StocksToTrade will guide you through the market’s twists and turns.
Dig into StocksToTrade’s watchlists here:





Leave a reply