

Exascale Labs Holdings Inc. stocks have been trading up by 19.01 percent after unveiling a breakthrough exascale AI platform.
Key Takeaways
- Shares of XLAB have fallen sharply from late-September highs above $2.80, recently closing around $1.36 after heavy selling pressure.
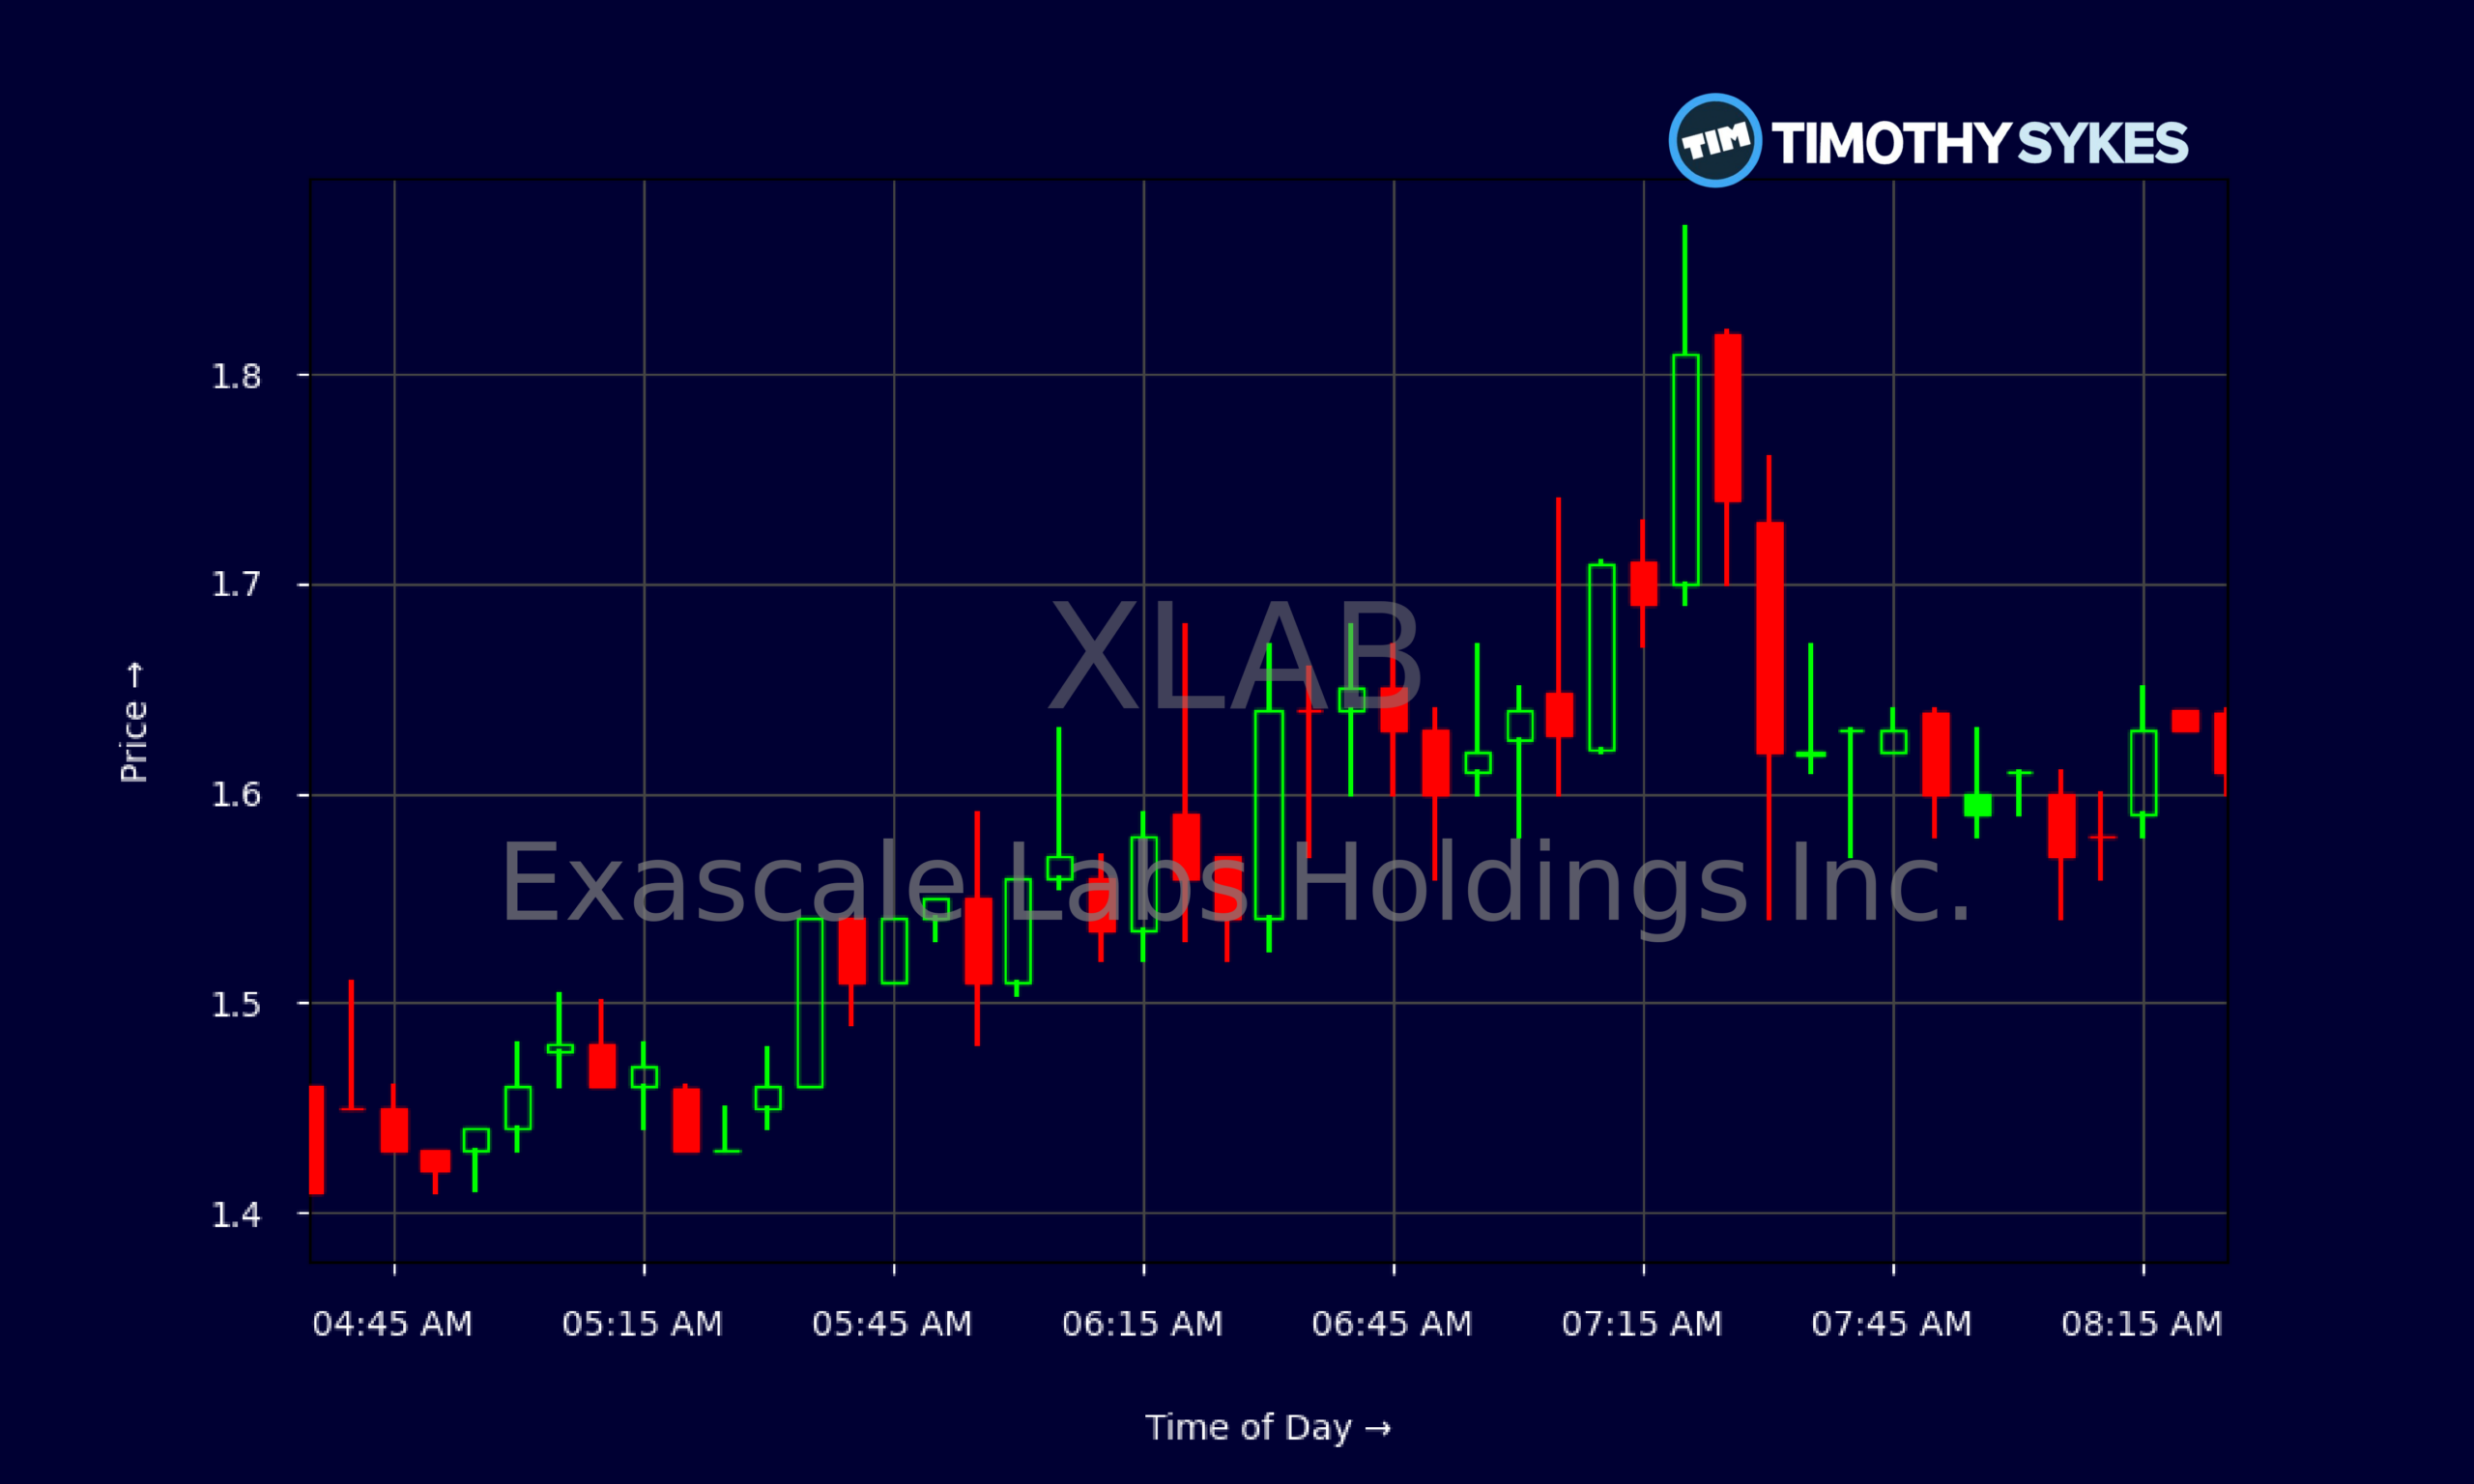
- Intraday XLAB trading shows tight consolidation near $1.50–$1.65, signaling a tug-of-war between dip buyers and profit-takers.
- Exascale Labs Holdings Inc. reported about $7.0M in revenue but still runs deep losses, with a pretax margin near -70%.
- XLAB carries negative equity and heavy current liabilities, so dilution and volatility remain central trading risks.
- Active traders are watching whether XLAB can hold the $1.30–$1.40 area and build a base for the next momentum wave.
Live Update At 08:33:24 EDT: On Friday, October 16, 2026 Exascale Labs Holdings Inc. stock [NASDAQ: XLAB] is trending up by 19.01%! Discover the key drivers behind this movement as well as our expert analysis in the detailed breakdown below.
Quick Financial Overview
Exascale Labs Holdings Inc. is a classic high-risk, high-volatility small-cap story. XLAB generated about $7.0M in revenue over the trailing period, but the business is far from profitable. The pretax profit margin sits around -70%, which tells traders the company is still spending heavily to grow or simply stay alive. That kind of red ink usually translates into choppy trading and frequent offerings.
On the balance sheet, XLAB shows roughly $7.3M in total assets against about $20.3M in total liabilities. Stockholders’ equity is a steep negative at about -$13.0M, and working capital is also deeply negative. That means Exascale Labs Holdings Inc. leans on capital markets and short-term liabilities rather than a strong asset base.
More Breaking News
At the same time, the latest cash-flow data shows XLAB raising roughly $4.3M from common stock issuance and ending the period with about $7.2M in cash. So the runway is not zero, but traders in XLAB have to assume more dilution is always possible. This mix of weak profitability, negative equity, and fresh cash is exactly what creates the wild price swings short-term traders look for.
Why Traders Are Watching XLAB Price Action
For XLAB, the chart tells the real story. At the end of September, Exascale Labs Holdings Inc. traded near $2.80–$3.00, then started a steady slide. Daily closes stepped down from $2.80 on 2026/09/21 to $2.40–$2.60 over the following days, before cracking into the low $2s and then the high $1s. That’s a big percentage air pocket in under a month.
More recently, XLAB flushed from the mid-$1s down under $1.00 and bounced back to a $1.36 close. The 2026/10/15 candle shows a huge intraday range — low at $0.78, high at $1.45. That kind of wick signals panic selling early, then aggressive dip buying. Momentum traders love this pattern because it proves there’s both fear and demand in the name.
Zoom in to the intraday 5‑minute chart and you can see XLAB grinding between about $1.45 and $1.67, with repeated tests of the mid‑$1.50s. That looks like consolidation after a big move, not a clean trend. When XLAB opens around $1.49–$1.51, slips into the mid‑$1.40s, then snaps back over $1.60 within an hour, it screams “day-trader battleground.”
For Exascale Labs Holdings Inc., fundamentals are weak but tradable. The negative return on assets near -36% and a price-to-sales ratio around 16.7 show traders are paying up for story and volatility, not current earnings. XLAB is a pure price-action play right now. That’s why short-term traders track support near $1.30 and resistance in the $1.60–$1.70 area for potential breakouts or breakdowns.
Conclusion
XLAB sits at the crossroads of ugly fundamentals and exciting trading opportunities. Exascale Labs Holdings Inc. has negative equity, heavy current liabilities, and a pretax margin deep in the red. On paper, that looks terrible. But in the market, this setup often translates into explosive moves as sentiment swings between hope and fear.
The latest cash raise gives XLAB some near-term breathing room, yet it also reminds traders that dilution is part of the game. When a company like Exascale Labs Holdings Inc. repeatedly taps equity markets, each spike in the chart can become a potential selling window for new shares. That tension is exactly what creates the big intraday ranges now showing up in XLAB.
For active traders, the key is not falling in love with the story. It’s about respecting the levels. If XLAB holds above recent lows near $0.80 and keeps building higher lows around $1.30–$1.40, momentum traders will look for a push back toward the $1.80–$2.00 zone. If those levels crack on volume, the next leg down can come fast. As millionaire penny stock trader and teacher Tim Sykes says, “Consistency is key in trading; don’t let emotions dictate your trades.” That kind of disciplined approach helps traders stay focused on price action and risk management rather than getting swept up in hype or panic.
As Tim Sykes likes to say, “Patterns repeat, but you have to be prepared to strike only when the odds line up in your favor.” With Exascale Labs Holdings Inc. and XLAB, that means studying the chart, knowing the weak balance sheet backdrop, and treating every trade as just that — a trade, not a long-term promise.
This is stock news, not investment advice. Timothy Sykes News delivers real-time stock market news focused on key catalysts driving short-term price movements. Our content is tailored for active traders and investors seeking to capitalize on rapid price fluctuations, particularly in volatile sectors like penny stocks. Readers come to us for detailed coverage on earnings reports, mergers, FDA approvals, new contracts, and unusual trading volumes that can trigger significant short-term price action. Some users utilize our news to explain sudden stock movements, while others rely on it for diligent research into potential investment opportunities.
Dive deeper into the world of trading with Timothy Sykes, renowned for his expertise in penny stocks. Explore his top picks and discover the strategies that have propelled him to success with these articles:
- Penny Stocks Trading Guide
- Best Penny Stocks Under $1 to Buy Today
- Top 8 Penny Stocks to Watch on Robinhood
Once you’ve got some stocks on watch, elevate your trading game with StocksToTrade the ultimate platform for traders. With specialized tools for swing and day trading, StocksToTrade will guide you through the market’s twists and turns.
Dig into StocksToTrade’s watchlists here:



Leave a reply